
Electron Cloud
It wasn't until the 1990's that the buildup of high densities of low-energy electrons was identified as the reason behind performance limitations in many types of particle accelerators over the preceding decades. Nowadays the incorporation of means to prevent the buildup of electron clouds is a necessary feature of modern accelerator design. These electrons cause a wide variety of undesirable effects, such as increased beam size, beam loss due to instabilities, distortions of the magnetic lattice optics, noise induced in instrumentation, vacuum contamination and increased heat load on cryogenically cooled accelerator components. The predominant source of free electrons in electron and positron storage rings such as CESR is the production of photoelectrons by synchrotron radiation photons hitting the interior surface of the vacuum chamber. The collision of these electrons with the beam pipe can then produce one or more secondary electrons, depending on the secondary electron yield (SEY) of the material. If the average SEY is greater than unity, the cloud density will grow exponentially, until a saturation is reached. Electron clouds can adversely affect the performance of accelerators, and are of particular concern for the design of future low emittance positron damping rings. At CesrTA we study the buildup of the cloud, evaluate cloud mitigations, and measure impact of the cloud on the dynamics of trains of bunches. CESR is instrumented with retarding field analyzers and time resolving detectors and microwave resonance detectors to measure cloud growth and mitigation. We measure the effect of beam processing on secondary emission yield of vacuum chamber materials. The induced tune shift provides information about electron cloud density averaged around the entire storage. We have developed specialized instrumentation and experimental techniques and computer simulations to measure interaction of the cloud with the beam.Retarding Field Analyzers
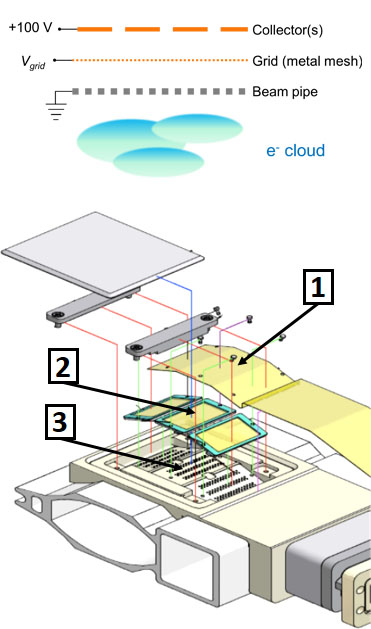
Top: Schematic of an RFA. Bottom: Blowup of an RFA mounted on a dipole magnet chamber showing the collectors (1), retarding grids (2), and beam pipe holes (3).
Measuring the Time Development of Electron Cloud Buildup
Similarly to the time-integrating retarding field analyzers described above, these three types of detectors sample the flux of cloud electrons incident on the vacuum chamber wall. By recording time intervals of a few hundred nanoseconds in time bins of 0.1-1 ns, they provide information on the short-time-scale behavior of the electron cloud after it has reached its equilibrium state. They are therefore also sensitive to the momentum distribution of cloud electrons, which depends on the various physical processes contributing to cloud dynamics, such as photoelectron production, secondary electron emission, and electromagnetic forces sourced by the beam, the cloud space charge, and any externally applied magnetic fields.Shielded Button Detectors
Repurposed beam-position monitor button electrodes placed behind an array of holes in the vacuum chamber which shield them from the direct beam signal provide sub-nanosecond time resolution for recording signals produced by cloud electrons passing through the holes. Measurements on shielded-button-equipped vacuum chambers with interior cloud-buildup-mitigating coatings such as titanium-nitride, amorphous carbon and diamond-like carbon provide quantitative information on the degree of success in reducing the cloud.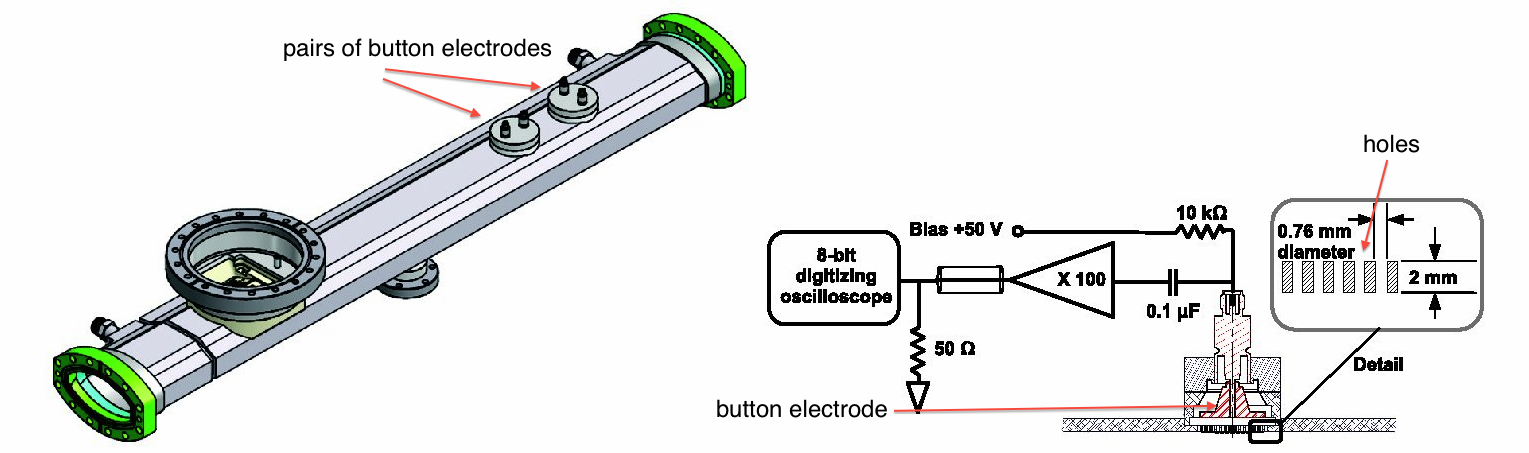
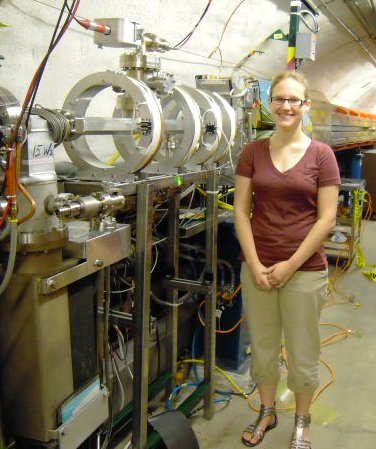 2012 NSF REU participant Emily Hemingway exhibits the custom vacuum chamber
outfitted with shielded button detectors which was the object of her summer research. The white coils provide the option to impose an
external longitudinal magnetic field as an additional means of cloud buildup reduction.
By using one positron bunch to create the cloud and injecting a second positron "witness" bunch at some distance behind the first, one obtains
accurate estimates of the growth and then decay of the cloud as the electrons are released and re-absorbed into the vacuum chamber wall.
2012 NSF REU participant Emily Hemingway exhibits the custom vacuum chamber
outfitted with shielded button detectors which was the object of her summer research. The white coils provide the option to impose an
external longitudinal magnetic field as an additional means of cloud buildup reduction.
By using one positron bunch to create the cloud and injecting a second positron "witness" bunch at some distance behind the first, one obtains
accurate estimates of the growth and then decay of the cloud as the electrons are released and re-absorbed into the vacuum chamber wall.
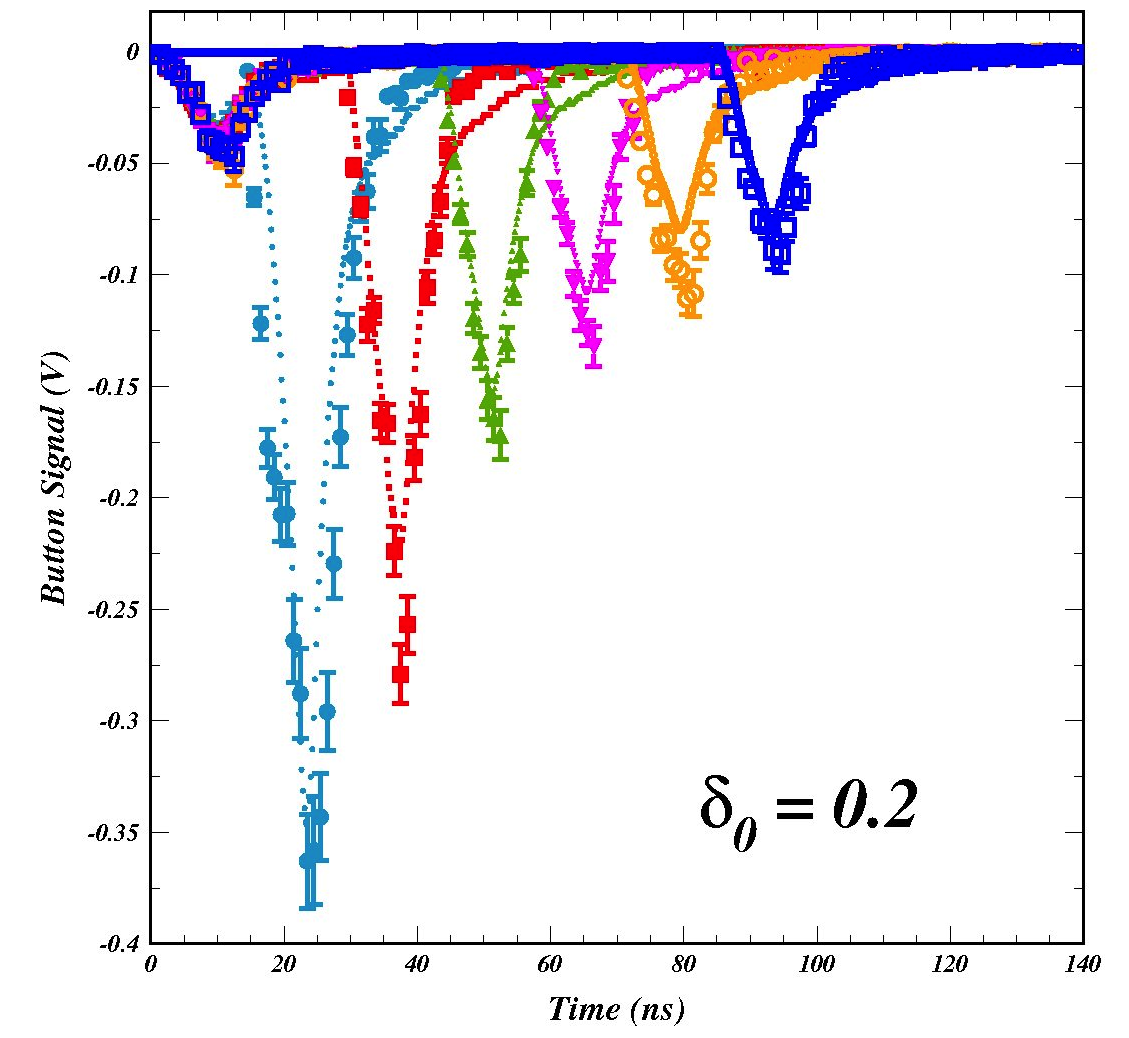 Superpositions of such two-bunch
signals (with variable distance witness delay of from 14 ns to 84 ns) show the the evolution of the electron cloud in a titanium-nitride coated chamber.
The dotted lines show the measured shielded button signals recorded by an oscilloscope. The points with statistical error bars are from simulation.
The model best matches the measurement when the secondary emission yield for low-energy electrons is set to 20%.
Superpositions of such two-bunch
signals (with variable distance witness delay of from 14 ns to 84 ns) show the the evolution of the electron cloud in a titanium-nitride coated chamber.
The dotted lines show the measured shielded button signals recorded by an oscilloscope. The points with statistical error bars are from simulation.
The model best matches the measurement when the secondary emission yield for low-energy electrons is set to 20%.
Shielded Stripline Detectors Installed in a Strong Quadrupole Magnetic Field
In 2013 the first measurements of long-term electron cloud trapping in a positron storage ring were made using specially designed shielded stripline detectors small enough to fit inside a quadrupole magnet. Cloud electrons passing through the array of holes in the vacuum chamber are collected on copper traces etched on kapton sheets. The transmission properties of the stripline limit the time resolution to about 12 ns. Nonetheless, cloud buildup along trains of 14-ns-spaced trains of positron bunches is measured with high precision.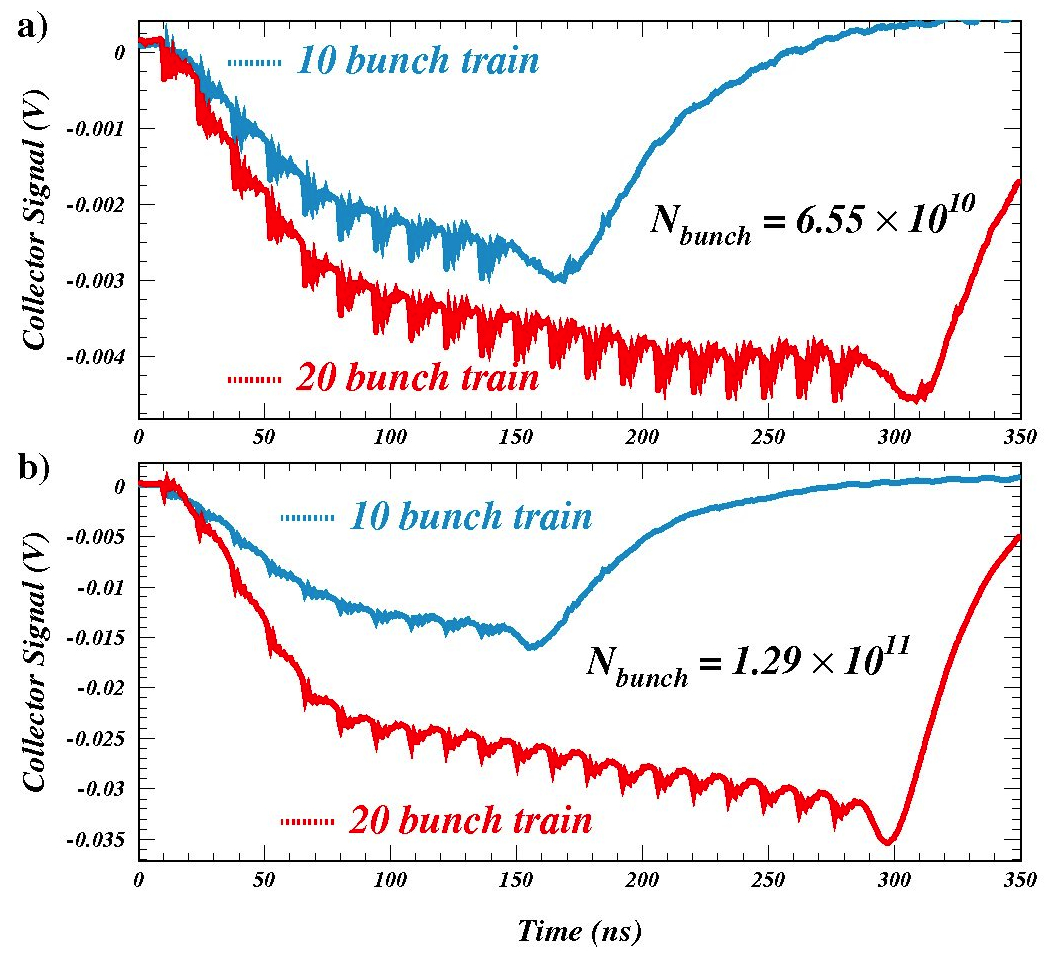 Proof of cloud trapping was obtained in an elegantly simple way: the signals obtained from 20-bunch trains were observed to be much larger
than those from 10-bunch trains. How do the ten leading bunches in the 20-bunch train "know" that they are in a 20-bunch train? The only
reason can be that cloud has remained trapped in the quadrupole magnetic field ("magnetic bottle" effect) since the previous passage
of the train two microseconds earlier.
Comparison of the figures a) and b) shows that cloud trapping increases with the bunch population.
Proof of cloud trapping was obtained in an elegantly simple way: the signals obtained from 20-bunch trains were observed to be much larger
than those from 10-bunch trains. How do the ten leading bunches in the 20-bunch train "know" that they are in a 20-bunch train? The only
reason can be that cloud has remained trapped in the quadrupole magnetic field ("magnetic bottle" effect) since the previous passage
of the train two microseconds earlier.
Comparison of the figures a) and b) shows that cloud trapping increases with the bunch population.
Time-Resolving Retarding-Field Analyzers
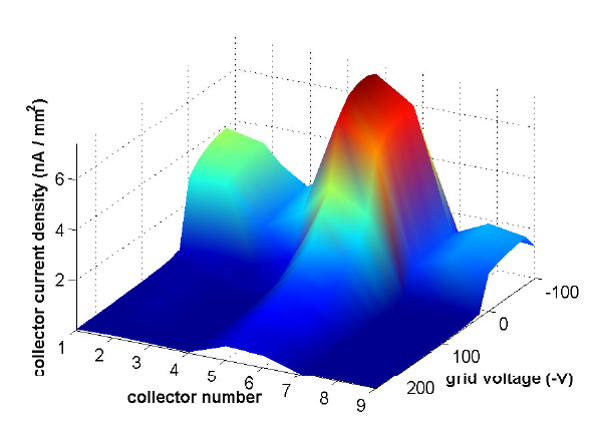
Time-resolving retarding-field analyzers employ shielded striplines similar to those installed in the quadrupole magnet to combine the good time-resolution with the electron-energy-discriminating capability of retarding field analyzers. The tunable potential barrier preventing lower-energy cloud electrons from reaching the stripline collector is provided by an intermediate grid similar to those described above for the time-integrating retarding field analyzers. The nine adjacent copper traces in this TR-RFA design also provide information on the transverse structure of the cloud, which exhibits a strong dependence on the magnitude of an applied magnetic field.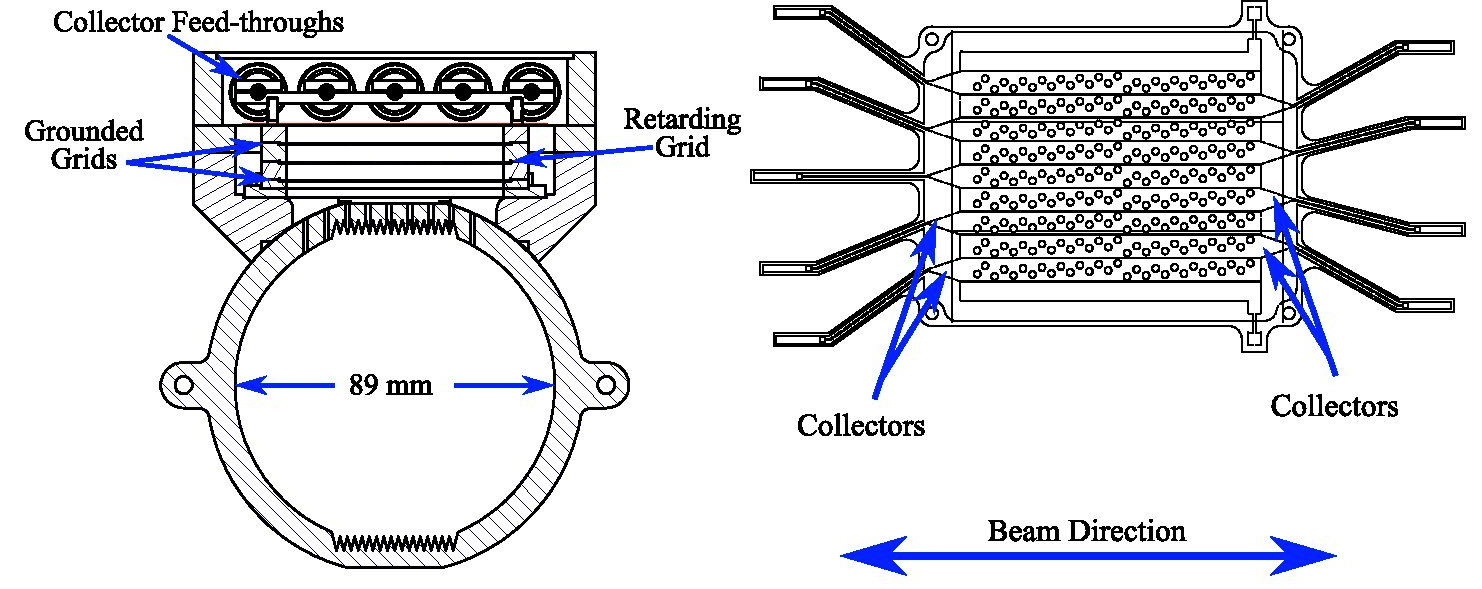 Four custom vacuum chambers were outfitted with TR-RFA's in order to measure the
cloud mitigation provided by grooves and titanium-nitride coatings. The groove pattern on the top and bottom of the interior of the
vacuum chamber are designed to be particularly effective in a vertical dipole magnetic field where cloud electrons tend to spiral
tightly around field lines in the vertical plane passing through the beam.
Four custom vacuum chambers were outfitted with TR-RFA's in order to measure the
cloud mitigation provided by grooves and titanium-nitride coatings. The groove pattern on the top and bottom of the interior of the
vacuum chamber are designed to be particularly effective in a vertical dipole magnetic field where cloud electrons tend to spiral
tightly around field lines in the vertical plane passing through the beam.
 For high beam currents, severe distortions of the accelerator magnetic optics
have been shown to be caused by cloud electrons passing through the beam in dipole magnets. The measurements of such betatron tune shifts are described below.
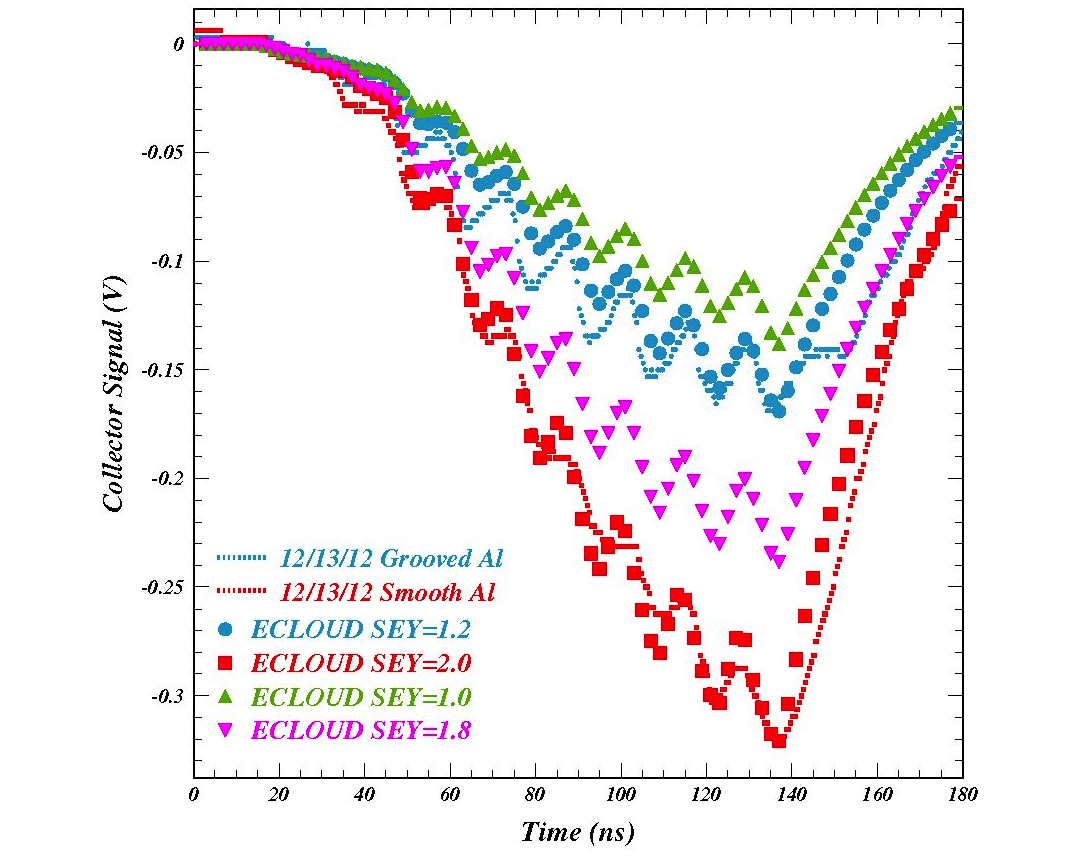
The first quantitative estimates of the mitigating effect of the groove pattern in an aluminum beampipe were obtained with TR-RFAs in 2013.
Even without an external magnetic field, the grooves were shown to reduce the cloud density by about a factor of two.
The figure on the right shows that models precisely reproduce the measurements when the assumed peak secondary emission yield is decreased from 2.0 to 1.2.
For high beam currents, severe distortions of the accelerator magnetic optics
have been shown to be caused by cloud electrons passing through the beam in dipole magnets. The measurements of such betatron tune shifts are described below.
The first quantitative estimates of the mitigating effect of the groove pattern in an aluminum beampipe were obtained with TR-RFAs in 2013.
Even without an external magnetic field, the grooves were shown to reduce the cloud density by about a factor of two.
The figure on the right shows that models precisely reproduce the measurements when the assumed peak secondary emission yield is decreased from 2.0 to 1.2.
Microwave Resonance Measurement of Electron Cloud
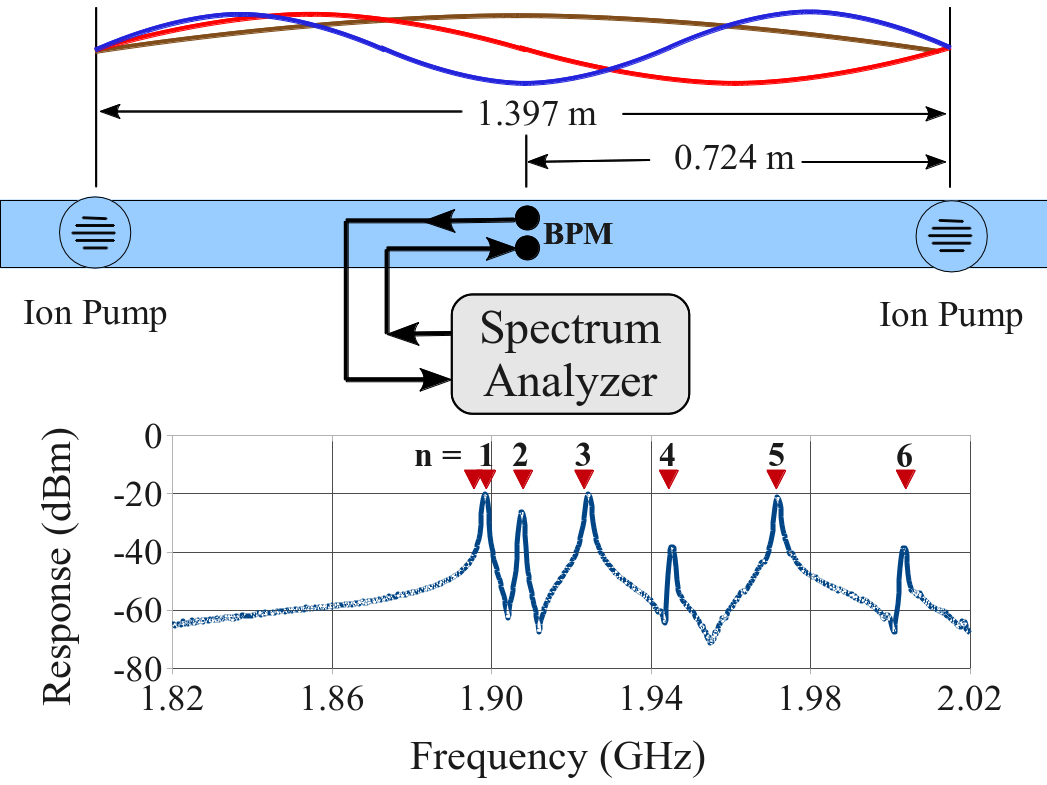 Accelerator beam-pipe can be resonant at several frequencies. In this case, the change in geometry near two vacuum pumps creates several resonances, with the first just below 1.9 GHz.
Microwaves can be used to measure the electron cloud density in accelerator beam-pipe. (references measurements, theory). When microwaves are introduced within the volume of the beam-pipe, there will often be several frequencies where the beam-pipe has a resonant response. These resonances can be produced by relatively small changes in the shape of the beam-pipe along its length. The exact frequency of a resonance can also be affected by small changes in the beam-pipe shape. For example, it is possible to make a measurable change in a resonant frequency by squeezing the beam-pipe between your hands.
The resonant frequency will also be changed by the presence of electron cloud. This effect is not large. At electron cloud densities that are large enough to be important to accelerator beams, the change in resonant frequency is only about 0.001%. Techniques have been developed to turn this small effect into reliable a measurement tool. This includes significant work by several students who were part of the Research Experience for Undergraduates (REU) program.
Accelerator beam-pipe can be resonant at several frequencies. In this case, the change in geometry near two vacuum pumps creates several resonances, with the first just below 1.9 GHz.
Microwaves can be used to measure the electron cloud density in accelerator beam-pipe. (references measurements, theory). When microwaves are introduced within the volume of the beam-pipe, there will often be several frequencies where the beam-pipe has a resonant response. These resonances can be produced by relatively small changes in the shape of the beam-pipe along its length. The exact frequency of a resonance can also be affected by small changes in the beam-pipe shape. For example, it is possible to make a measurable change in a resonant frequency by squeezing the beam-pipe between your hands.
The resonant frequency will also be changed by the presence of electron cloud. This effect is not large. At electron cloud densities that are large enough to be important to accelerator beams, the change in resonant frequency is only about 0.001%. Techniques have been developed to turn this small effect into reliable a measurement tool. This includes significant work by several students who were part of the Research Experience for Undergraduates (REU) program.
In-Situ Measurement of Secondary Emission Yield
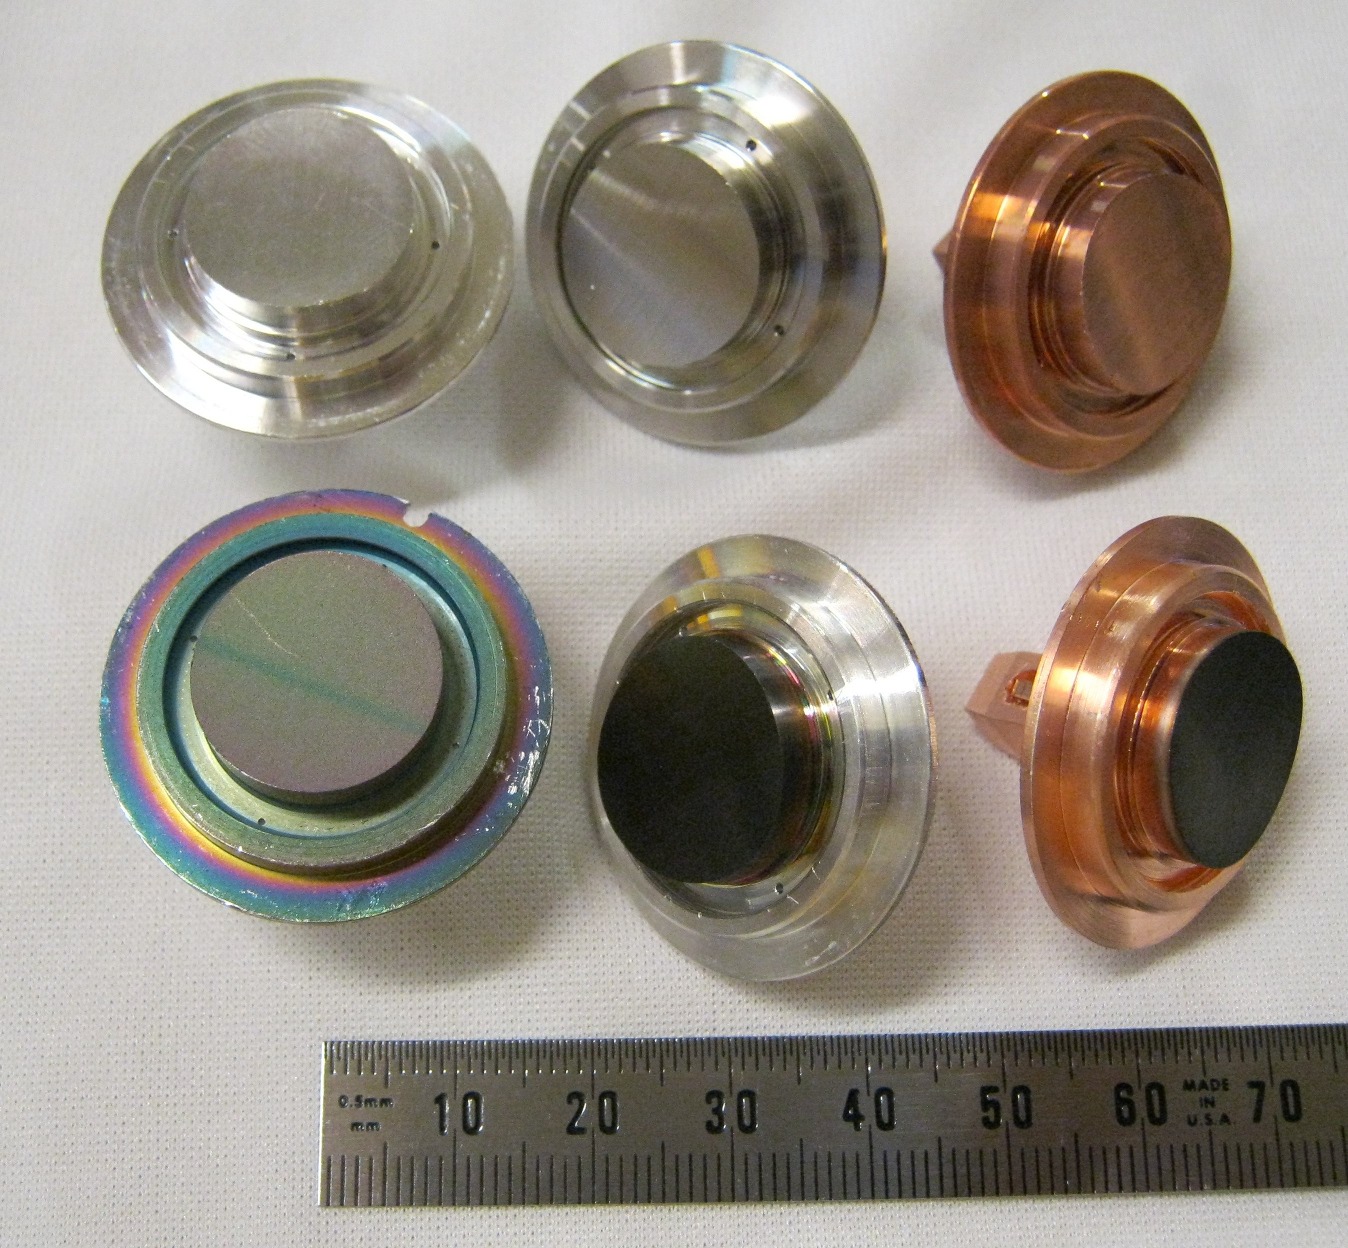
Samples for in-situ SEY measurements. Clockwise from top left: aluminum, stainless steel, copper, copper with amorphous carbon coating (coated by CERN), aluminum with diamond-like carbon coating (coated by KEK), aluminum with titanium nitride coating (from SLAC).
- electron photo-emission: synchrotron light from the stored beam hits the walls of the vacuum chamber and releases electrons
- electron secondary emission: electrons from the cloud hit the walls of the chamber and release more electrons
Electron Cloud Induced Tune Shift
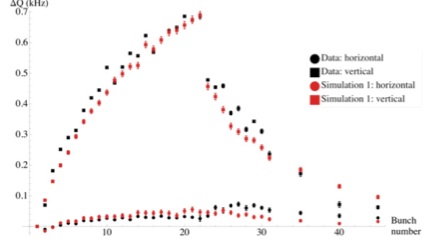
Measured horizontal and vertical tune shift of each bunch in a train of 22 bunches of positrons (black symbols), and simulated tune shifts (red symbols). The bunches are 14ns apart. Measurements beyond 22 are with a witness bunch.
Electron Cloud Beam Dynamics
The dynamics of the stored positron beam is affected by the presence of the electrons in a cloud, which had been generated by synchrotron radiation from the beam traversing bending magnets and amplified by being accelerated by the passage of other positron bunches together with the secondary emission yield from impacting on the vacuum chamber walls. The density of the electron cloud at a given point the storage ring grows as a train of positron bunches moves past the point and at the same time the cloud causes particles in the positron bunches to be deflected. These deflections can produce motion of the center of bunches (called dipole motion) along the train, where the amplitude of the motion increases as one moves from bunch-to-bunch down the train. They can also cause internal motion within the positron bunches, for example the lead particles at the head of a bunch may be deflected in one direction and the particles at the tail of the bunch in the other direction (called head-tail motion.) Generally these excitations grow as the density of the electron cloud increases along the train of bunches. The combination of dipole and head-tail motion can cause the transverse size of the bunches to grow. Since the vertical size of the bunches is much smaller than the horizontal size, the electric field strength and, hence, the forces are much stronger in the vertical direction. These forces will cause the vertical size of the later bunches in the train to become enlarged. Instrumentation has been developed to explore these interactions. This includes 1) x-ray beam size monitors, which can measure the vertical size of all the bunches within a train on a turn-by-turn basis, 2) a turn-by-turn beam position monitoring system with approximately 100 monitors around the storage ring, 3) a peak rectified beam position monitor signal, which can be gated on individual bunches within the train and which is observed with a spectrum analyzer, and 4) pulsed deflectors, which can excite the motion of individual bunches within the train. Examples of typical measurements are seen in the figures below.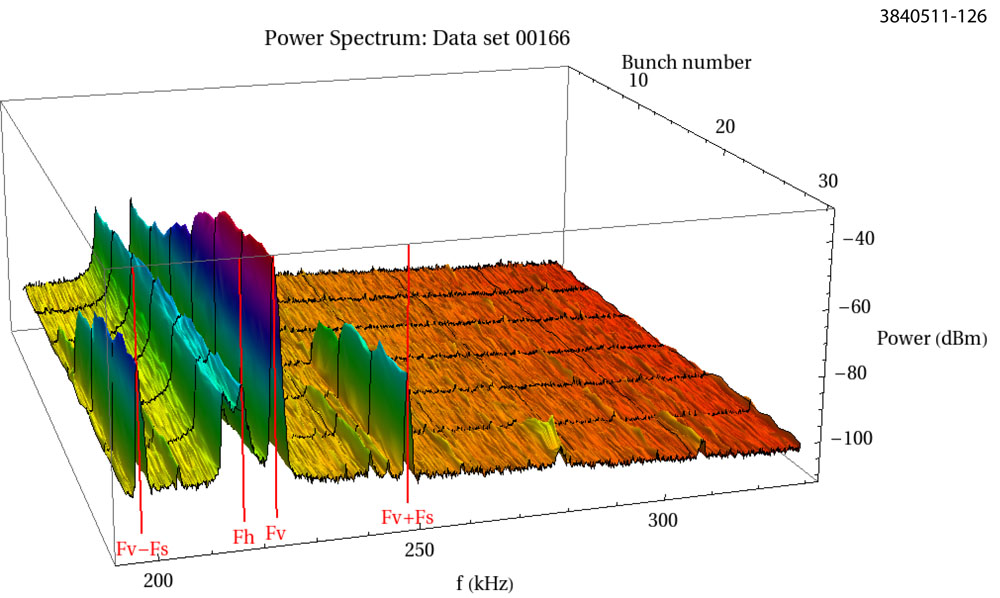
Surface plot of the logarithmic spectral amplitudes of the observed beam position monitor signal vs. bunch number within a 30 bunch-long train of positron bunches with 1.9 nC/bunch. Note that the coherent horizontal and vertical frequencies (Fh and Fv, respectively) of the dipole modes of oscillation are labeled for bunch 30. Also note the coherent head-tail mode frequencies are labeled for bunch 30 as Fv-Fs and Fv+Fs. Observe that the coherent dipole mode amplitudes are visible for the first bunches in the train and they grow in amplitude as the bunch number increases. At the same time the coherent head-tail modes are not visible for the first bunches, but their amplitudes become visible and then grow as one goes from the first bunches in the train to the last. This growth of motion along the train indicates that later bunches are becoming less stable than earlier bunches.
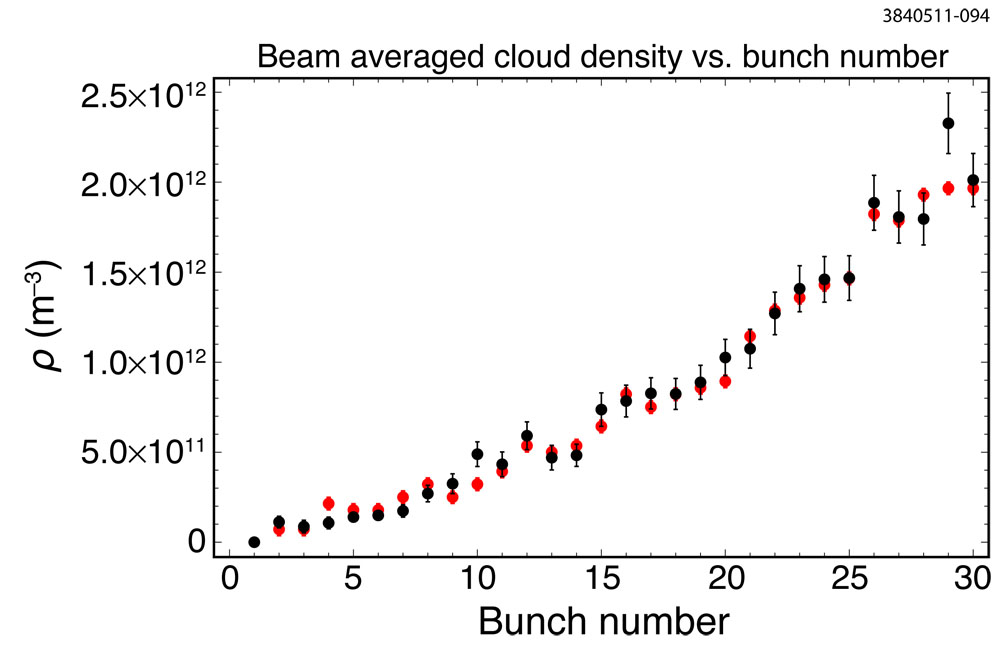
Average initial electron cloud density vs. bunch number, comparison between estimate from measured tune shifts along the train, caused by the presence of the electron cloud (red), and simulation (black) from the program, POSINST.
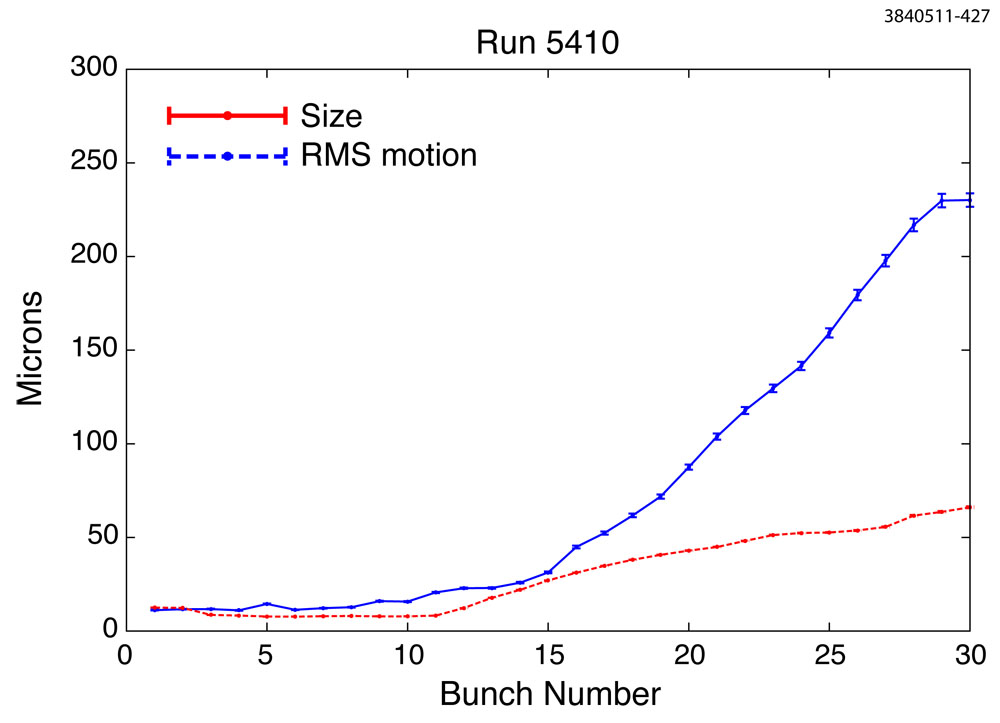
Bunch-by-bunch beam size and RMS vertical motion for a 30 bunch long train with a 14 ns spacing between bunches with a charge of 1.9 nC/bunch.
Simulations of Interaction of Electron Cloud and Particle Beam
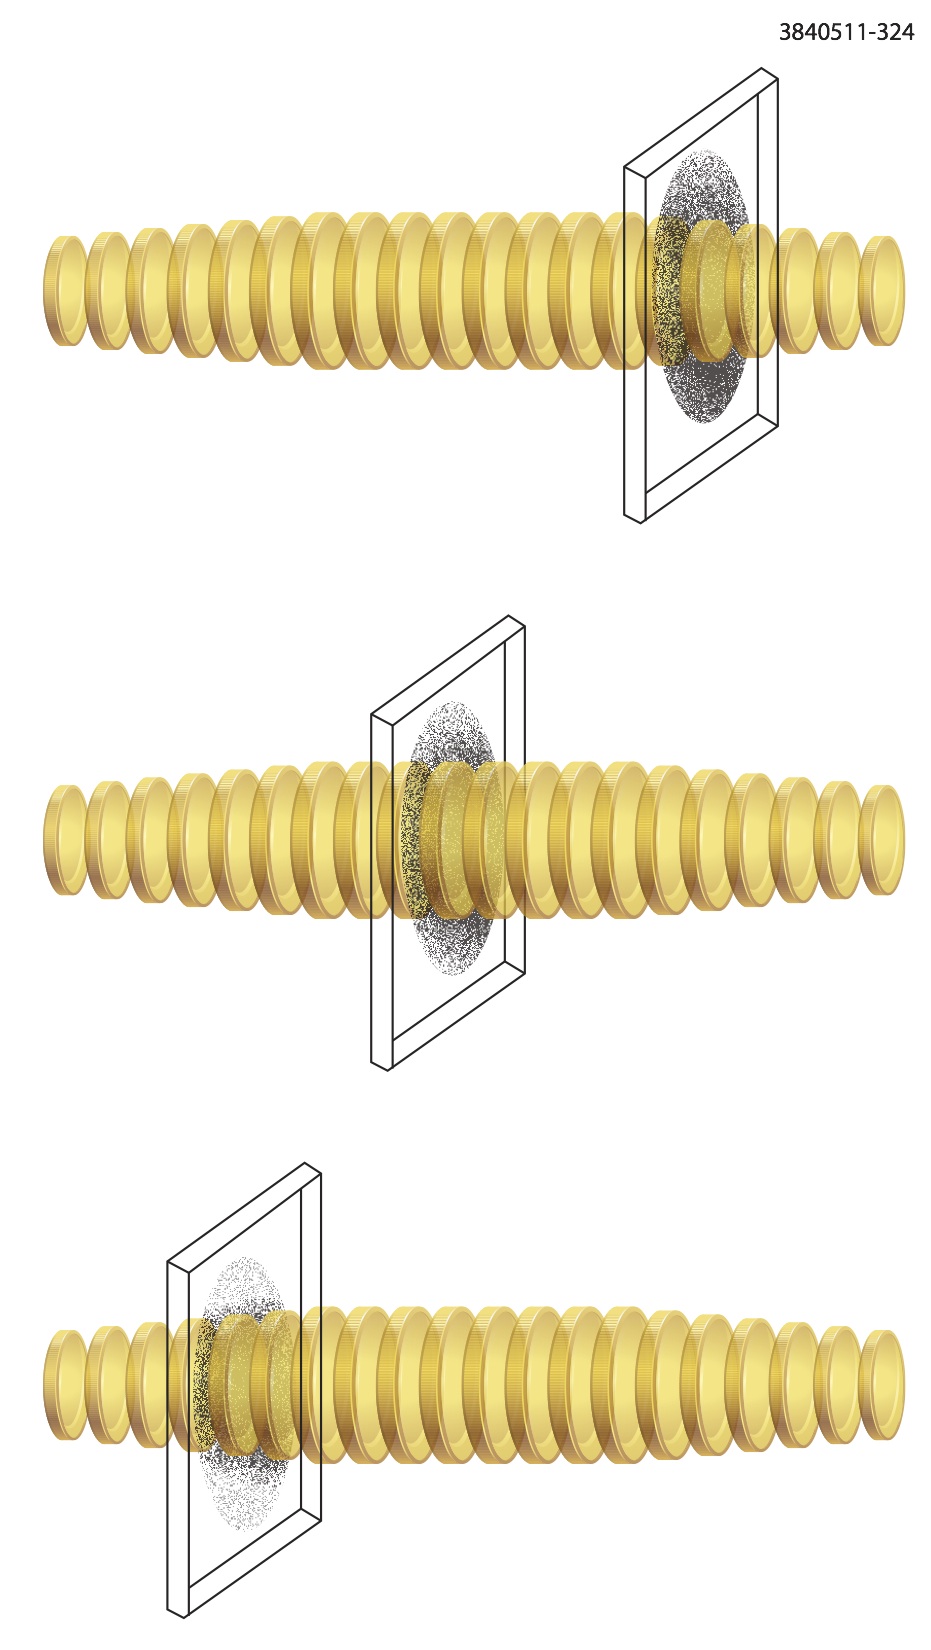 As the positron bunch passes through the cloud, the low energy electrons are trapped and forced to oscillate in the potential well of the positively charged beam. The electric and magnetic fields of the electrons
in turn can destabilize the positrons.
The CMAD code was developed to simulate the interaction of positron bunch and electron cloud. For the simulation, the positron bunch is sliced as shown in the figure. The slices of positrons near the head of the bunch focus the electrons. Positrons in the trailing slices experience the full force of the concentrated electrons.
As the positron bunch passes through the cloud, the low energy electrons are trapped and forced to oscillate in the potential well of the positively charged beam. The electric and magnetic fields of the electrons
in turn can destabilize the positrons.
The CMAD code was developed to simulate the interaction of positron bunch and electron cloud. For the simulation, the positron bunch is sliced as shown in the figure. The slices of positrons near the head of the bunch focus the electrons. Positrons in the trailing slices experience the full force of the concentrated electrons.